
Which Teams Are The Best At The Draft?

Every team drafts busts. It’s a fundamental property of the NFL. It’s probably a good thing- the draft process is more entertaining when there’s risk to it. You can pour over college prospects, forming your own opinions of who will succeed in the NFL and who won’t. There’s no point to that if everyone will be good.
Naturally, some teams are better at this than others. But figuring out who that is presents a tough challenge. You can look subjectively, pick-to-pick, but that’s inevitably subject to your own biases. You can use Pro-Bowls, or other stats, but it’s incredibly difficult to put together a system that evaluates players across positions that are measured differently. Passing yards work for WRs, QBs and TEs, but they aren’t quite useful for LTs or run-defending 1-techs. Luckily, we have Career Approximate Value. You can read that link for the nitty gritty details, but in short, it’s a season-to-season sum of a player’s value to their team, regardless of position. It allows you to compare a strong safety’s value with your favorite running back on an even scale.
It’s also difficult to compare players in the draft when different draft picks have different expectations. Matt Stafford may have contributed more to his team than Richard Sherman, but Sherman was ultimately better bang for his 5th round buck. So it’s important to reward teams when they find talent other teams aren’t finding, and dial back the rewards on no-brainers that were selected 1st overall.
Using CAV, as well as these round values from Football Perspective (seriously read this article), I’ve been able to throw together a measure of draft success. My methodology can be found at the bottom of the article, but I know what you philistines are here for.
The Results
These results are from 2011-2015. Most teams have made a front office switch at some point over this period, so all the individual years are separated. Just know that in the chart below, everything is relative to league average, or zero. The further you are from zero, the further you are from the middle.
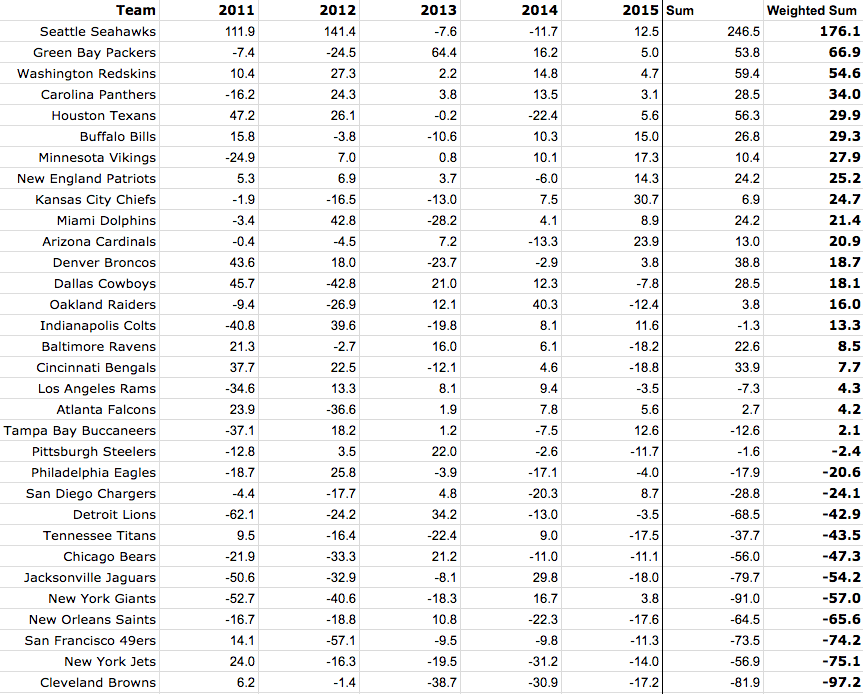
There’s a lot to unpack here, so buckle up.
The first thing that leaps off the page is the absolute dominance of John Schneider and the Seattle Seahawks. It’s no wonder they exploded out of perpetual misery almost instantaneously The 2011 and 2012 drafts have fueled a period of perpetual dominance in the NFC, and that’s no coincidence. It’s interesting to see how much of an outlier this is, and how unreasonable it would be to ever expect it again.
One of the best drafts of the whole bunch (Seahawks aside) is the 2013 Packers draft, where they acquired constants at LT (Bakhtiari), RB (Lacy), and S (Hyde). They also got nice late-round value from Nate Palmer and Charles Johnson, who are wins simply because they contributed, which is more than we can usually expect.
It’s no surprise to see the Browns so firmly at the bottom of the list. With spectacular busts like Trent Richardson, Justin Gilbert and Johnny Manziel, it’s a lot to come back from. Here’s to hoping, fellow Sashi fans.
The Chiefs experienced a stark turnaround when they replaced Scott Pioli with John Dorsey. They’re still licking the wounds from three years of blown picks (including the selection of Eric Fisher 1st overall), but should this recent surge continue, they should cement themselves in the upper echelons of the AFC.
Despite a very good 2014 draft, Jacksonville can’t seem to catch a break. With all those busts comes a ton of money meant for 2nd contracts that gets hurled at free agency, creating a hodgepodge of sloppy seconds trying to compete around a quarterback who is unraveling at the seams.
The 2012 draft, not the 2011 one, is the biggest boost to the Carolina Panthers. Strangely, Dave Gettleman’s results have been much more controlled.
The Redskins have been remarkably consistent under Scot McCloughlan. Makes you wonder.
One of the biggest outliers of the entire data set is Andrew Luck, who catapults the Colts near average, where they would otherwise be one of the worst drafting teams in the NFL.
The bottom dozen teams fall off harshly from the rest of the pack. While teams like the Steelers and Buccaneers are close enough to average where the symbol in front of the number can pretty much be ignored, the teams directly below them are declining rapidly. Even the “best” of that bunch only have the occasional playoff appearance to show for it the last few years.
Since this is a Vikings blog, I’ll spend a little more time with Minnesota. Overall, we grade out well- in the top ten and even above Bill Belichick’s Patriots. All that includes the 2011 draft, an inarguable catastrophe that was quickly remedied. The promotion of Spielman to GM has had a clearly positive effect, with no below average drafts to speak of since they added future roster holes Christian Ponder, Christian Ballard and Mistral Raymond to the team.
Playing with weighting and the Vikings is fun. If you remove 2011, and just focus on the drafts where Spielman had sole power (a move that’s only fair since the Triangle of Authority power structure won’t be a reality worth considering, and removing it had a clear effect), he jumps to the 6th overall drafter. Weight the older drafts more (giving you a more stable outcome since there’s a lot yet to be learned about the 2014 and 2015 classes), he drops to 8th. Weight toward recency, like we’ve done above (but without 2011), and Spielman shoots up to 4th, behind only Schneider, Ted Thompson, and the now strangely fired Scot McCloughlan.
This can be attributed to two things. First, acquiring 1st-round picks generally helps you here, as those are the guys who have the lion’s share of the impact, positive or negative. Trading for players like Harrison Smith and Xavier Rhodes, by CAV, has outweighed disappointing results from Matt Kalil or Scott Crichton. Consistent success in the later rounds has also helped. Players like Jarius Wright, Shamar Stephen and Stefon Diggs allow the Vikings to gain value where other teams aren’t. While those aren’t world-beating players, they’re vastly outplaying the expectation for their draft position, and that adds up. Average picks, at those positions, wouldn’t be in the league anymore.
The way the 2014 and 2015 classes are shaping up, the future of the Vikings is still bright, quarterback controversies notwithstanding. It’s nice to zoom out and look at the big picture amid hazy frustrations involving 8-8 records, injuries and the tribulation of the most recent draft class.
Now, for the boring part. Check out if you want, I won’t be offended.
The Methodology
Adding up the CAV from every draft pick is a decent place to start, but we have a lot of work to do. First, we need to adjust for draft position. You get less credit for Andrew Luck than you do for Antonio Brown. Football Perspective’s numbers provide an expectation for the CAV of each draft pick – for example, the average 48th overall pick provides 9.9 points of CAV, but the average 14th pick provides 17.8 points. So by subtracting this from the picks, you can essentially give a higher expectation to higher picks- 1st rounders need to contribute more before they’re considered successful.
By this measure, picks outside of the top 100 have a very low expectation. Since many of those players flame out of the league within a year or two, it’s considered a victory to get any value at all. This explains the common strategy of taking huge risks in the 6th and 7th round, like Tyrus Thompson or Moritz Böhringer, to name a couple Vikings. If they flame out, it’s likely that would have happened anyways- may as well maximize upside.
These are total career values, and not subtracted if the draft pick didn’t stay with their team. We want to know if a team is drafting good players, not how they manage those assets in the future. For example, the Panthers made a great selection of Josh Norman in 2012, and will continue to accrue credit even though they made a salary-based decision to let him walk away. Those are separate choices, and should be evaluated in their own article.
After getting adjusted CAV for every player, we add up the totals for each team within that draft. We don’t average them, because that would punish teams who have more draft picks. While trading down for more picks may be frustrating to some, the lower value (in theory) of those players is how we represent the consequences. We don’t need to double punish them.
Once we have the draft hauls for 32 teams tallied up, we average that out, then subtract the average from each team’s tally. The reason we do this is to fix a few problems that CAV has. For one, it tends to overrate players who are typically seen as “busts”. For example, I couldn’t get past the idea that Matt Kalil, a quintessential draft bust, was given a +6.2 adjusted CAV. A positive. But then I realized that other players around him, such as Fletcher Cox and Luke Keuchly, were at +40.4 and +25.2, respectively. While the Vikings gained some ground with Kalil, other teams gained more ground. So compared to the average team drafting in that first round, Kalil is a loss, which seems appropriate.
Further, CAV underrates young players. It evaluates a player in the context of an entire career, and the score that player is given is as if that player’s career ended today. For example, Jameis Winston, a budding franchise quarterback, had a -10.6 adjusted CAV. If Winston became a born-again cult member and quit the league or something, he probably wouldn’t be seen as much of a success for a 1st overall pick, and that’s the context CAV uses. This evaluation is bound to change over time, but for now, almost every team got a negative score for 2015, and most teams were negative for 2014. Comparing to average grades everyone on a curve, and adjusts that problem away.
Once we subtract the average from each team’s total, we get the numbers you see under the individual year columns above. Add them up, and you get the “sum” column. Stop there if you want. You may notice that the 2011 and 2012 drafts have bigger numbers (positive or negative) than 2015’s. That’s because those players have had more time to separate out from the crowd. Even though we adjusted for youth earlier, we haven’t adjusted for the idea that good players get further ahead of bad players with each passing year. The “weighted sum” adjusts for this, putting more weight into recent drafts to artificially inflate their variance. Over time, this will become less necessary (and more stable), but for now, a good 2011 and a bad 2015 should be scored the same as an equally bad 2011 and an equally good 2015.
2016 isn’t used because all of the players are so young, there was barely any separation at all. Everyone is within the margin of error of each other, though, a couple of years from now, I’m sure teams like Dallas will shoot up and Minnesota will be hurt by their 2016 drafts.
By this method, we get a nice balance of high (though not insurmountable) expectations for high picks, and no punishment for the commonality of failed late picks. When one does succeed, that team gets more value for it, proportionate to just how much they contributed. Players don’t get high marks for simply existing on a roster, which is what derailed the piece in question in this post by PurplePTSD writer Joe Johnson. You have to exist and provide more than the people picked in your vicinity.
This method says nothing about free agency, trades, or cap management. Those are all to be evaluated separately, and require different methodology. CAV is also an unstable metric, and while we’ve done a lot to mitigate its flaws, its results are still subject to a lot of change. As players mature and find their place in the league, we’ll find out more about draft quality, but as it stands right now, the line between “haves” and “have nots” of the league seems to be drawn right here, on draft day.
Thanks for reading!